In a world where our lives are abundantly “online” a generous amount of customer/user information can be available at your fingertips. However, actionable marketing based on these insights may be difficult to determine in a haystack of so much data.In this article, we’ll walk through three easy ways to navigate Google Analytics to uncover insight surrounding your website visitors. Curious to know which package booked well last year, who is the most profitable guest, or why bookings are down? Read on!Note: below each section, we’ve included the click path in Google Analytics to find the report.
What booked?
Conversions -> Ecommerce -> Product Performance
Each Google Analytics account is set up differently. Generally, the product performance report will show the actual product you are selling (think different room types). The default Product Performance report is valuable in and of itself, allowing us to see how often a room type was booked (Quantity), total revenue (Product Revenue), average price, and the average length of stay (Avg. QTY) for that room type.
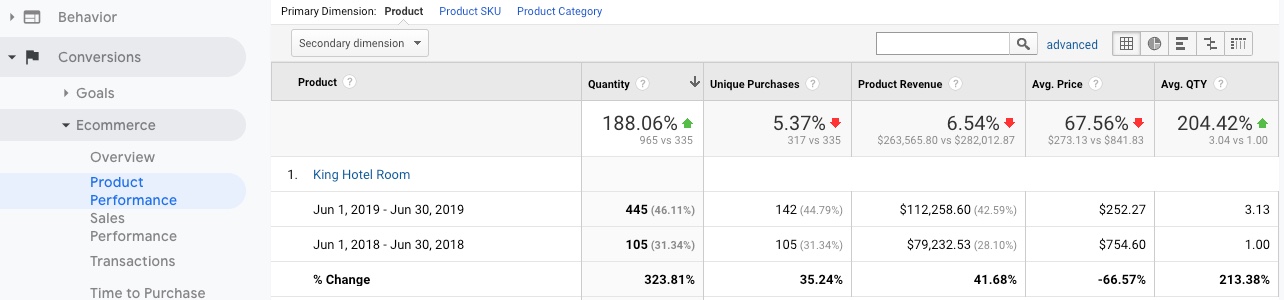
Taking this information a step further, click “Secondary Dimension” to add a custom variable.*Custom variables will need to be set up using code in a Google Tag Manager that will capture post-checkout information such as room nights, date of arrival, date of departure, package/rate plan name, number of rooms, number of children and adults. Custom variables will not collect any personally identifiable information such as names, emails, addresses, credit card information – as this is illegal.
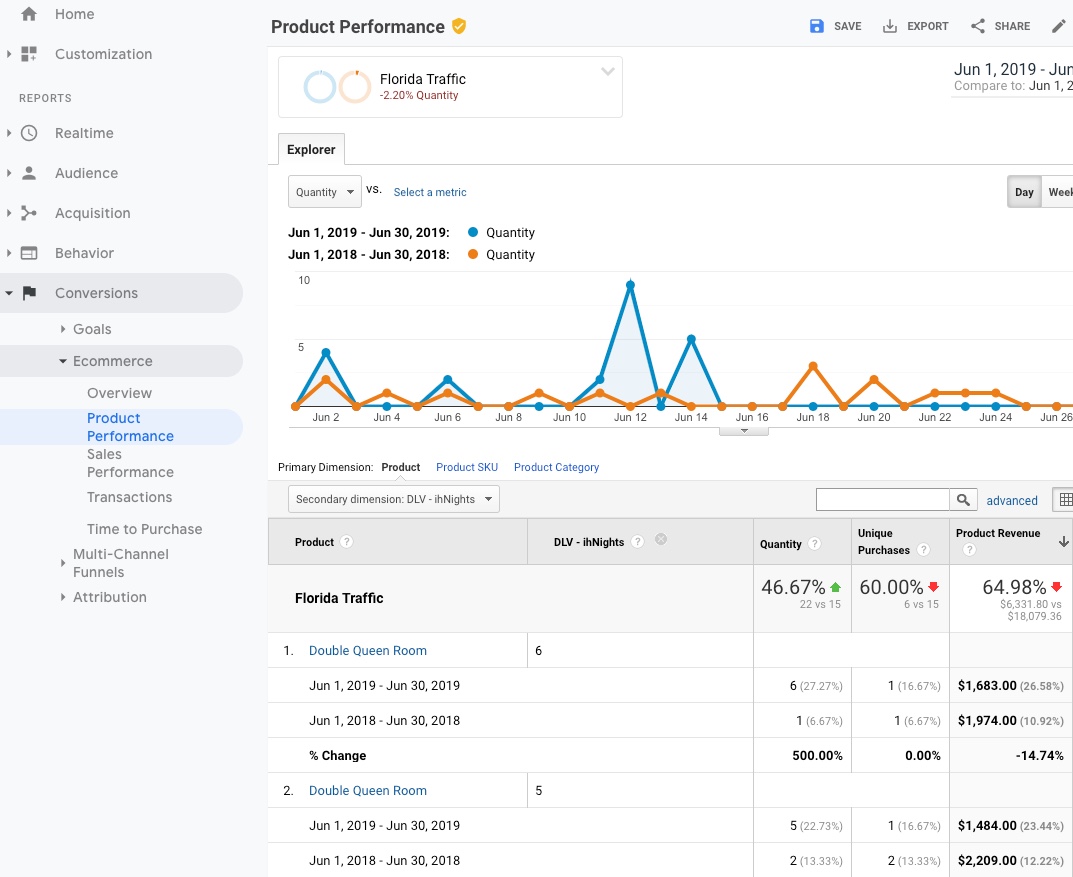
Organize the data by adding different filters and sorting based on any of the columns, like “product revenue”.We often use the Product Performance report and then segment the audience based on location to see if a specific market frequently booked a certain package or if there is a trend in their lengths of stay. Based on information gathered, we’ll build out highly targeted and personalized campaigns to test our theory if a certain package or messaging resonates with that market.
How often do people click to the booking engine?
Acquisition -> All Channels (Note: any report under All Channels will have the ability to view goal performance. For this article we’ll be reviewing the “Channels” report)
Setting up Goal Conversions can help track any action (called an “event” in GA) a website visitor takes on the website.We’ll skip over the technical setup of goal creation since Google already has a robust explanation here. The next steps show how easy it is to find stats once Goal Conversions have been set up and are tracking.In the top right corner of the table, there is a drop-down menu where different goals that have been set up can be selected.
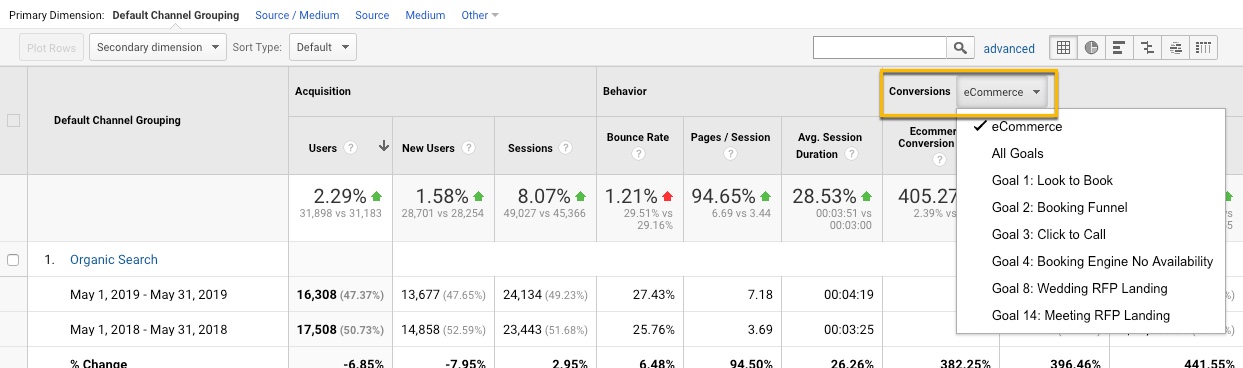
For the account shown above, we’ve labeled any click into the booking engine as a “Look to Book.”The importance of Look to Book statistics: If your website’s Look to Book stats are low, this could signal issues with user experience (cannot find the book now button on desktop or mobile), unclear offer (does it entice people to book or is it confusing what is included?), or maybe the offers are not as competitive within your market.In addition, a high Look to Book percent is great to see – but if the actual conversion rate is low or decreasing over time there may be issues with tracking on the booking engine, or, users are exiting mid-way through the checkout. If any of these are the case, test a booking yourself to see if it is recorded in Google Analytics or set up additional goal tracking on every page of the booking engine to see where people are dropping off.
Does unbranded PPC provide any value?
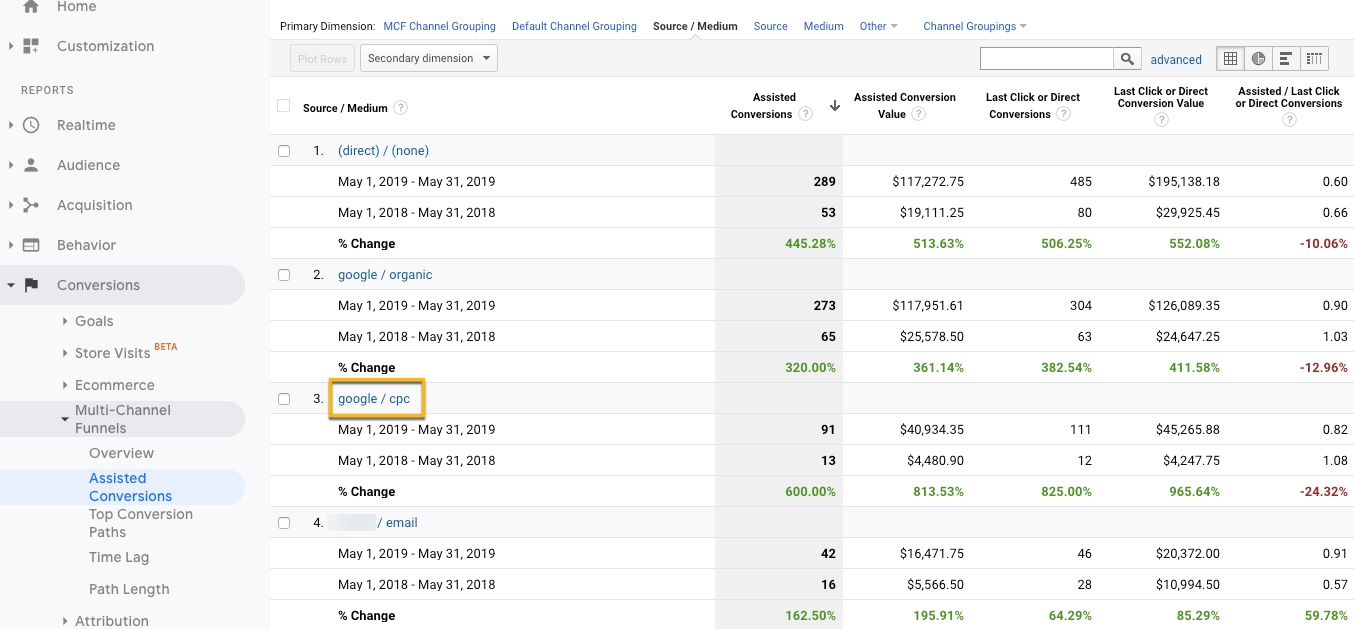
Conversions -> Multi-Channel Funnels -> Assisted Conversions
From desktop or mobile, pay-per-click (PPC) or social media advertising, even internet news articles – there are an unlimited number of ways a potential guest can wander onto your site. So many, in fact, Google has written multiple articles on each customer’s unique journey and multiple touchpoints (tip: click on each person to read about their path).Knowing that every touchpoint can help make a difference, it is vital to know which channels may be contributing valuable traffic – and Google Analytics Assisted Conversions report is just the tool to help put this web of connections in solid, understandable stats.Like other reporting in Google Analytics, data can be segmented at a high level based on channel groupings (organic vs paid vs referral), or you can dive deeper to see specific campaigns and sources through any of the primary dimensions.

To analyze performance from PPC campaigns, click on “Source/Medium” link in the primary dimension section – this will direct you to a new page that breaks out Google, Bing, and any other paid channel you may participate in. Google Ads, for instance, will typically appear on the list as Google / CPC. *Note: depending on how your Google Analytics account is set up, labels may vary.We recommend clicking into the channel you want to analyze in order to see a detailed list of campaigns for that channel.
Reviewing unbranded PPC efforts (keywords that do not use your hotel’s name), you can see the unbrand campaign had 7 assisted conversions, which means a guest interacted with an unbranded ad at some point in their purchase journey. The unbranded campaign also had 10 last-click or direct bookings, which means the unbranded ad was the last way the customer entered the site before making a booking.
Did you enjoy the read?
Get original hospitality industry insights delivered to your inbox. Sign up to receive Screen Pilot’s #TrendingNow Newsletter.