Google “travel during coronavirus” or any similar terms and you’ll discover a myriad of articles full of predictions. But the problem with predictions is that no one knows how or when the crisis of COVID-19 will actually come to a close.Travel in the aftermath of coronavirus could take the form of road trips or virtual reality experiences. But it could also take shape in ways we have yet to anticipate. Rather than relying on predictions, we here at Screen Pilot believe in generating our own data so we can help our hotel and resort partners discover their own stories.When it comes to encouraging travel during and post-COVID-19, the first step is to re-define who the prospective guests are for each hotel or resort, and what those audiences are looking for given that their needs have changed.Here are our favorite tools and tricks for developing a renewed audience profile that can inform everything from ad targeting to your content strategy.
Google Analytics
In Google Analytics, it can be hard to find what you’re looking for, especially if you want quick insights. The below reports are either available out of the box or can be set up by your agency partner or website team. All of the below information can help you understand who is the most likely traveler for not only your entire property but even individual room types.
Demographics Report
Navigate to the left rail of Google Analytics, then click into “Audience” and then open up the “Demographics” tabs. This is your Demographics Report. Here, you’ll find some of the most straight-forward audience insights Google has to offer. While the gender breakdown may or may not be useful, the Age report definitely is.This will tell you the average age of people who visit your site, broken down by those who are the most engaged (i.e. spend the most time on your site) and those who contribute the most to your revenue. You can also compare to previous periods to see how this information has evolved pre, during, and post-COVID-19.
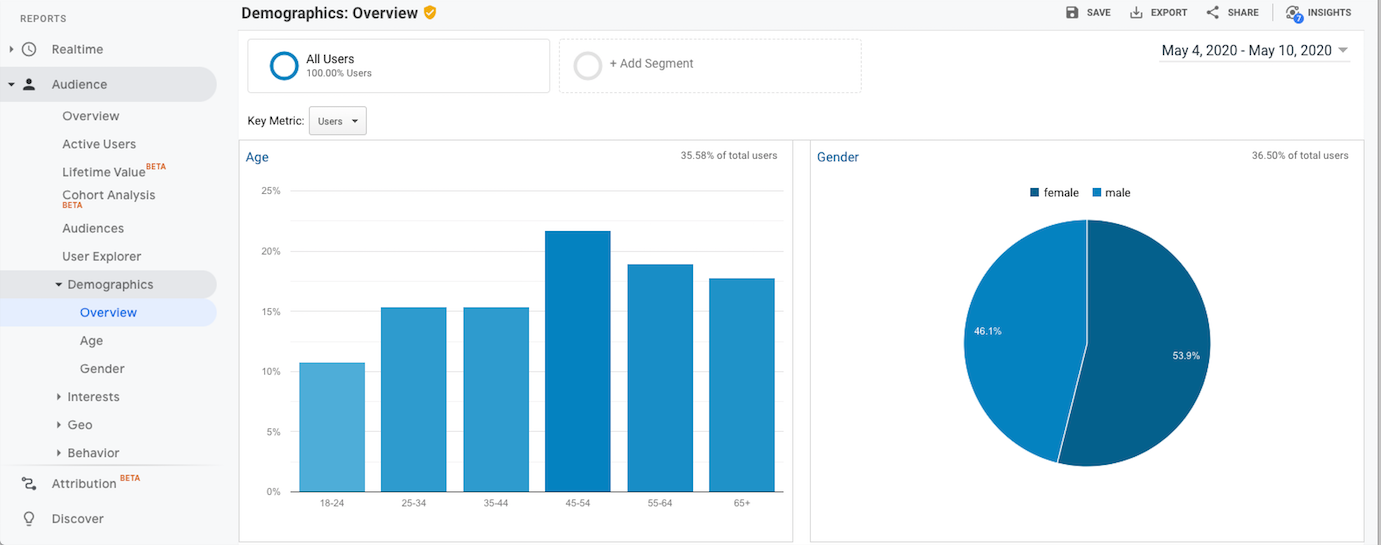
This can inform your messaging, the types of activities you feature in content, and the images you choose to market your resort and its amenities.
Geo Report
Make note of your demographics information, then jump down to the “Geo” tab. This tab reflects users’ locations. The default is to display their country, but you can click further to see region (i.e. state) and even city. Layer this with the demographic information to better understand the age and location profiles of the travelers who have become your most valuable guests during COVID-19.Screen Pilot Tip: Use pivot tables to pull Demographics and Geo metrics into a single view to streamline your analysis.
Custom Events Reports
Take your analysis of your demographic and geo reports one step further by implementing custom events. Custom events are additional pieces of code you insert into the GTM to track designated user actions. Read our custom event guide.Here at Screen Pilot, we implement custom events for our partners to trigger along every step of the booking process. When doing audience research, we can then use a pivot table to layer actions like searching for dates with a users’ region. These events, and the various layers you can add to them, will allow you to visualize the shopping windows for your property by state.Find this report by navigating to “Behavior” then clicking into “Events.”
Example chart you can produce using custom events data. If, for example, you find that people who live in New York are, on average, searching for stays in August and September, you can use this information to inform your messaging and imagery strategy for that market. We’ve noticed that COVID-19 is continually shifting shopping windows, so this is the information you’ll want to stay attuned to as you plan your paid media engagements.
Product Report
Before exiting Google Analytics, take a peek at your product categories as well. You can find this report by clicking on “Conversions” in the left rail, then selecting “Ecommerce” and “Product Performance.” This is another dimension that is tied to a piece of code in your GTM, so you’ll want to be sure you have this implemented correctly.

For Screen Pilot partners, the product category is tied to room type. By viewing this report, we can see the most booked rooms. We can also use pivot tables to layer other information of interest, like region or age, to determine which people from where are ultimately booking what room types. COID-19 may have impacted this information, too, as the rise of road trips and a forecasted increase in multi-generational travel might make for new guest needs.
Analyze Your Search Terms
Google Analytics tells the story of the users who arrive on your site and what they do once they’re there. But there’s a whole world outside of your website, and likewise a wealth of information that can peel back the curtain on your prospective guests. Search terms are one of these things.Here at Screen Pilot, our tool of choice for this is SEMrush. In SEMrush, you can navigate to their Organic Research report and type in your hotel or resort’s domain. From here, you can export a full list of keywords that your hotel or resort ranks for, as well as the percentage of your organic traffic that comes from each keyword.You can break down these lists in many ways. But for our partners, we like to analyze the subject themes that appear throughout the list. At the time they found your property’s site, were they searching for area restaurants? Local beaches? Hotels with ballrooms?Once you’ve sorted keywords into content categories, make note of which are ranking well AND driving traffic to the site, as well as those which are ranking well but are NOT driving traffic to the site. Use this information to inform your content strategy.
Google Trends
If you’ve ever typed your property name into Google Trends and got a flat line, you might think this tool is useless. But it can actually be incredibly valuable when used in the right way. Use it as a tool to take a peek into the trends and sentiment surrounding your property’s market and the things that travelers are looking for in your area. Are people more interested in hotels or resorts? Is their interest in road trips increasing? Does there seem to be a lot of buzz surrounding beaches over state parks?Google Trends can answer some of these questions, but it can also be a great litmus test once you have some content ideas in place. After all, timing is everything. If your June content plan is to write a piece of content about the beach, Google Trends can be a great way to gut-check this idea.Audience research is one of the first steps in planning your post-COVID-19 strategy. Need assistance? Get in touch.
Did you enjoy the read?
Get original hospitality industry insights delivered to your inbox. Sign up to receive Screen Pilot’s Weekly COVID-19 Resource Center.