Our hotel and resort partners always ask the Screen Pilot Paid Media Team this one question:
“What are my competitors doing?”
Though diving into your own data is the best first step in campaign planning, you always need to consider the marketplace in which your promotions will live. Competitors are a prominent part of that landscape.
For hospitality and travel marketers’ specifically, competitors take two forms: rival hotels and resorts and online travel agents (OTAs). Other hotels, resorts, and brands can threaten your hotel’s traffic, but OTAs are often seen as the most direct competitor. OTAs eat away at both a property’s traffic and their bottom line in the form of commission.
There are several ways to understand how and where OTAs are encroaching on your audience. If you have a subscription to tools like SEMrush, you can input their domain to see a wide variety of insights for both their organic and paid activity. But if you’re wondering how OTAs and competitors are bidding in your paid media auctions, we always recommend going straight to the source: Auction Insights Reports from Google Ads.
What Is the Auction Insights Report?
The Google Ads Auction Insights Report compares your performance to that of brands bidding in the same auctions you are. Because these reports are based on your auction, you must be bidding in order to access them—even if you’re bidding just $1 per day.
These reports are the key to your competitors. The reports offer up competitor performance across five key metrics. Here at Screen Pilot, we use these metrics to inform bidding and budgeting for our own partners to ensure that, budget allowing, OTAs and competitors won’t get the upper hand.
As you optimize your bids, stay tuned to the Auction Insights Report so that you never miss an opportunity to beat out other brands. Your ability to rise in the search engine results page might make the difference in whether or not you capture your conversion or it goes to a competitor.

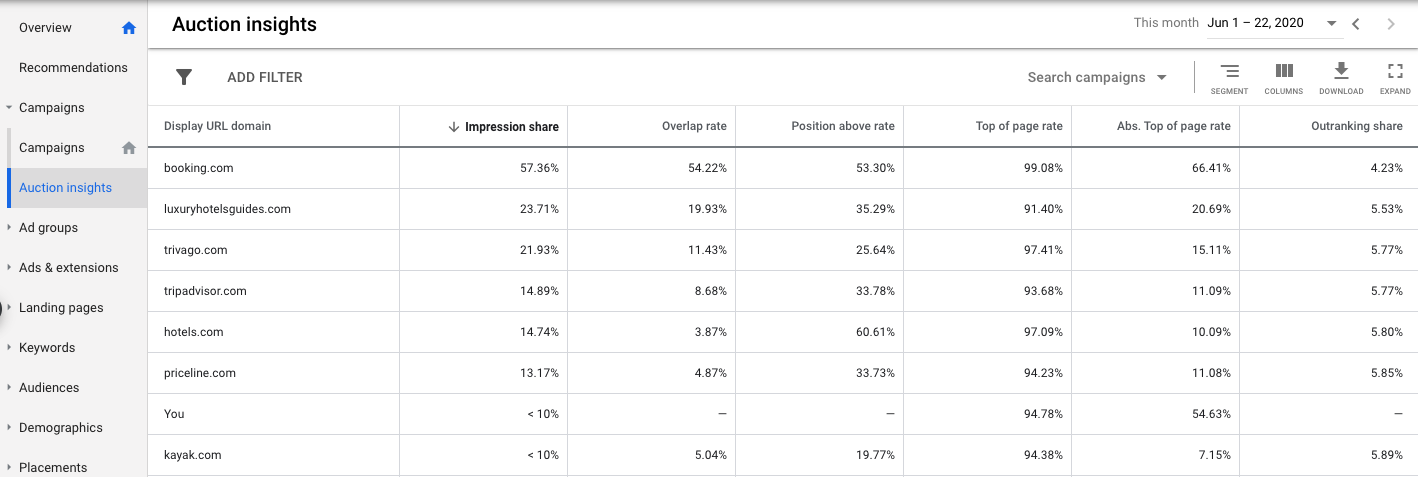
Sample Auction insights report from Google Ads
The Five Metrics of Auction Insights
There are five metrics in total that Google Ads reports on to help you visualize your auctions: impression share, overlap rate, position above rate, top of page rate, and outranking share. You can access all five for Search Campaigns, but Shopping Campaigns are limited to impression share, overlap rate, and outranking share.
Impression Share
Google Ads Help explains Impression Share as “the number of impressions you received divided by the estimated number of impressions you were eligible to receive.
”Eligibility, according to Google Ads Help, is based on a cocktail of targeting, approval statuses, and Quality Scores. In an Auction Insights Report, you can see the impression share of other brands within the auctions both you and those brands were eligible for.
Overlap Rate
Ever wonder when both you and another brand received an impression during the same search? That’s what overlap rate will tell you. In the Auction insights report, if the overlap rate is listed as 30%, that means 3 out of 10 times your ad and a competitor’s ad showed for the same search.
Position Above Rate
This statistic describes the rate at which a competitor’s ad showed above yours for a search in which both of your ads were shown. A 15% position above rate means your competitor out-ranked you 15 out of 100 times your ads appeared for the same search.
Top of Page Rate
Top of page rate is exactly as it sounds—the rate at which your ads appeared at the top of the above and above organic search results. Google Ads expands on Top of Page Rate to also deliver Absolute Top of Page Rate, which is the rate at which your ads appeared as the first ad on the SERP.
Outranking Share
Outranking share is a careful calculation by Google Ads. They explain it as “the number of times your ad ranked higher in the auction than another participant’s ad, plus the number of times your ad showed when theirs did not, divided by the total number of ad auctions you participated in.”
How to Interpret Auction Insights Data
The five metrics above can answer almost any question you may have about your competitors’ strategies—and how that’s affecting your own campaign performance.
You can review Auction insights for each of your auctions to better understand how a competitor is impacting your performance, how CPCs are changing in response to the number of competitors also bidding on them, if new competitors have emerged in your auctions or if there are competitors bidding directly on your brand terms.
Each of these insights will help you further optimize your campaigns so you can clear competitors out of the way.
An example: you look at impression share and your hotel has a higher impression share than your competitor. You notice, however, that your competitor has a high outranking share. This tells you that even though your brand is appearing for more terms, your competitor’s ads are appearing above yours when their ads do show.This means that they may be prioritizing outranking your brand and that they may value certain terms over others. You can then re-evaluate your own bid strategies accordingly.
A Screen Pilot Partner Example
This Screen Pilot partner is a beach resort located in Southern Florida. Their relaxing setting and beachfront amenities have amassed a loyal following. As a result, this resort has continued to bid throughout the coronavirus pandemic. The Screen Pilot Paid Media Team selected a target cost-per-acquisition bidding strategy for the entirety of the pandemic.
In January, their average CPC was $3.62. That CPC dropped to $1.93 by March and continued to decrease to $0.74 in April. By May, CPCs began to climb and reached an average of $0.96. Their average CPC for June sits at $1.67, higher than their lowest CPCs but still quite a bit under their account average pre-coronavirus.

Beach resort’s CPC and impression trends for January 1 through June 18, 2020. CPCs dropped beginning in March and have remained low even as impressions rise.
This resort’s CPCs aren’t as low as they have been, but, historically, they are still earning cheap clicks. In this instance, the Auction insights report (below) can help us understand why costs per click are low even though their impressions have clearly begun to climb.
If we look at the Auction insights report for their brand keywords, we can see that few competitors are bidding on these terms. Those that are bidding are bidding at a fairly low level, so this resort is capturing the majority of the impression share. Because this resort doesn’t have much competition, they don’t have to pay as much to turn those impressions into clicks.

The beach resort’s Auction insights reports for impression share from February through June.

Impression share trend line from the Auction insights report. This shows the activity for the beach resort and the top competitors for this auction.
Because costs remain low and they continue to earn clicks, they can focus bids on terms that may have been otherwise out of reach. They can bid for top of page for terms where they aren’t landing there already. Or they can explore other terms to target with the cost savings from these brand campaigns.
Once they identify some new terms, they can again dive into their Auction insights reports to understand how other brands are bidding and what they’ll need to do to rise to the top.
Auction Insights for Your Region
Put the above tips to the test by analyzing Auction insights for your region. We’ve pulled reports for six regions across the United States. These reports are impression share aggregates for Screen Pilot partners located in each of these six regions. Find Auction insights at the bottom of each of the below pages.
Note: While the above reports will give you insights into your region, the report may vary for your own auctions. Be sure to take into account reports specific to your hotel or resort as you develop bid and budget strategies for your Google Ads campaigns.
Need help?
https://screenpilot.com/contact-us/covid-19-recovery-services
Did you enjoy the read?
Get original hospitality industry insights delivered to your inbox. Sign up to receive Screen Pilot’s Weekly COVID-19 Resource Center Update.


