/*** Social share ***/
May 20, 2020

Hotel Recovery Strategy Part 1: Using Data to Define Your Audience

Brett
 
Perry
Read
3
min
Brett
 
Perry
Read
3
min

Over the past two months, people have been inundated with charts and graphs showcasing the impact of COVID-19 on hotels across the world. If you're involved in hospitality, you've seen how this pandemic has shifted the mindset of travelers and plummeted occupancy rates.

Screen Pilot has been just as involved in this wealth of information. Our weekly data dives and numerous articles peeling back the curtain on hotels are often chock-full of charts and data points. Our efforts have been focused on finding the windows of opportunity in these bleak times.

Though we've done some of the interpretation for you in weeks past, this week, we want to equip you with some basic skills to start analyzing charts on your own. After all, the KPI's you've identified may be different than the ones we get excited about.

With this in mind, we'll walk you through some simple ways to use data to inform your hotel recovery strategy, starting with our four W's of data analysis: who, where, why, and when. You can find Screen Pilot's proprietary data on the front page of our COVID-19 Resource Center and in our weekly Wednesday newsletter.

Who, Where and Why : User Location and Keywords

Developing a COVID-19 recovery strategy won't yield results if you don't understand who you're talking to. The who, where, and why are key audience attributes that can help you build messaging and creative. To start, the first thing you need to understand is where website users are coming from.

Using a chart like below, you can get a sense of user location and can create assets to speak to these markets. If you're looking at just your hotel, Google Analytics offers a great user location report and demographics information.

User location and age don't tell the whole story of the journey to a website. We have to pay attention to the why behind it all. This is when we turn to good old search keywords. If your hotel is still running paid media efforts, using the Search Terms report is a great way to understand what people are searching for before clicking the ad. Here are a few more tips on monitoring paid activity.

If you're like many other hotels and you've paused media, you're relying on direct and organic traffic to pick up the slack. Google Search Console provides a wealth of information regarding organic website visitors. Specifically, it tells you exactly what they are searching for and provides associated metrics, such as click-through-rate, for each keyword. Use our Search Console guide to help navigate your analysis.
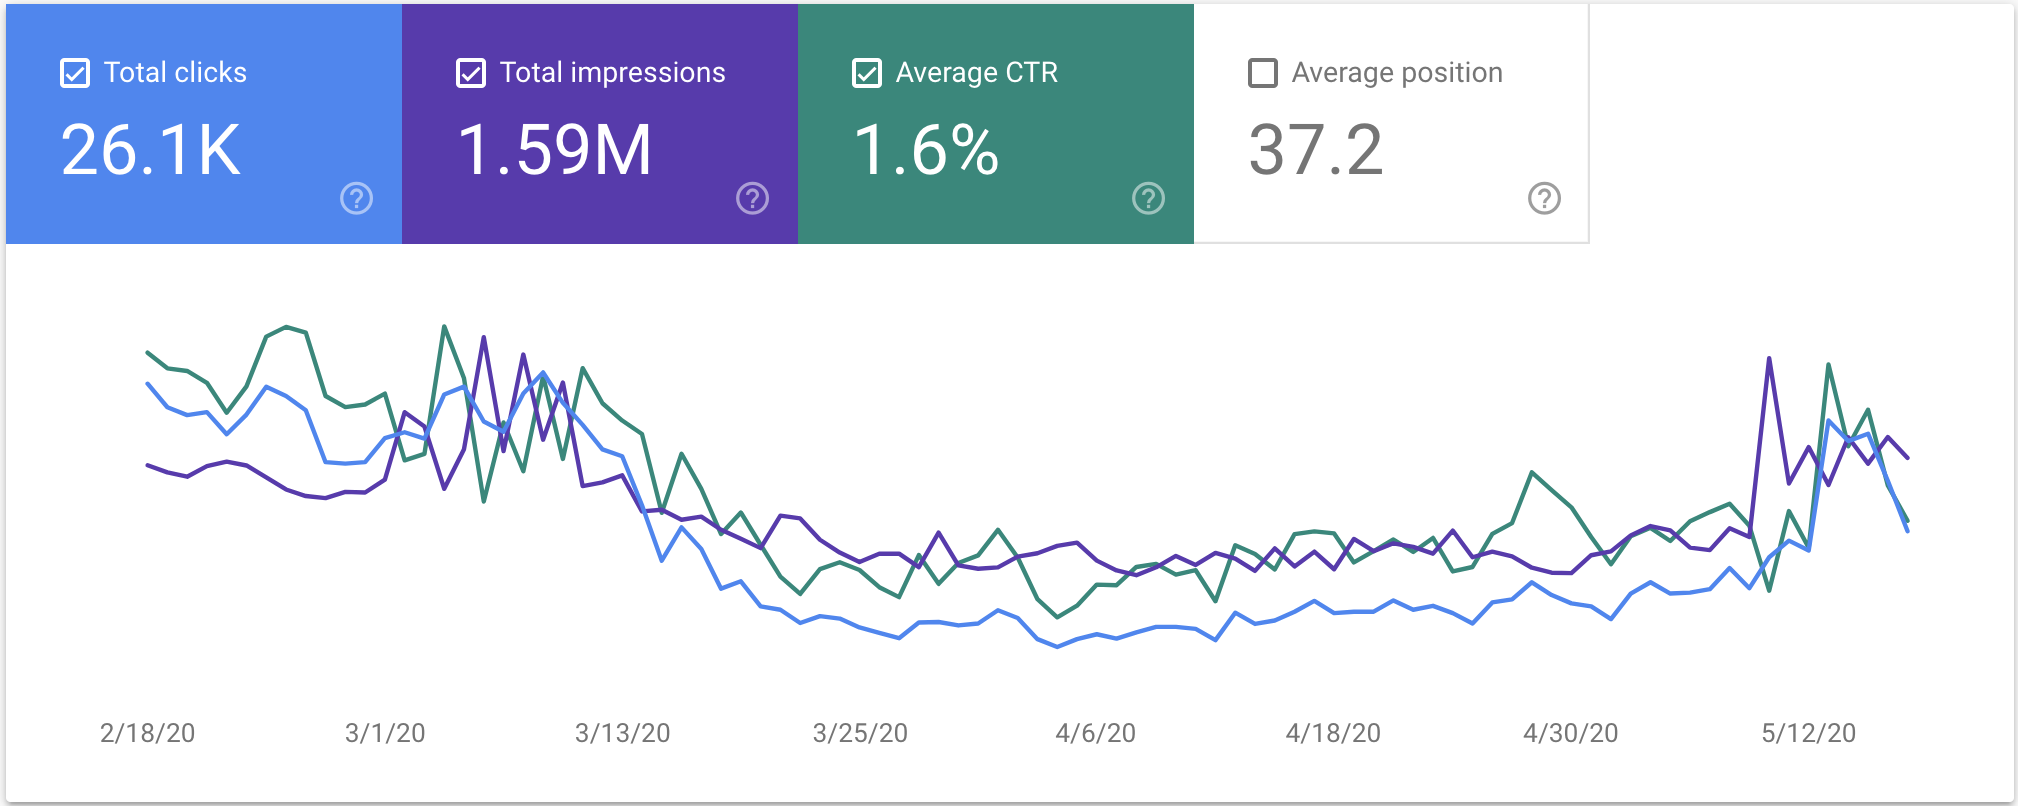
graph showing organic keyword impressions and clicks

When : Shopping Behavior

Let's say there is a hotel in Florida, Beachy Keen, and they have identified their audience using the process above. Their main focus is people in their twenties and thirties living within the state of Florida that have been searching for terms such as "beach resorts", "hotels near the beach" etc. Now they know who they are talking to and why users are looking to travel. The missing link is when people plan on traveling.

This is where shopping behavior plays a pivotal role in strategy development. If your hotel uses Google Analytics, we provided a unique way to track shopping windows. This process allows us to see the months that users are looking at in the booking engine and analyze the patterns. For example, the charts below show how the shopping window continues to shrink week-over-week and provide the exact month that people want to travel.

Beachy Keen analyzed this information for Florida and found users are now looking to travel within the next 30 days as opposed to the three months out we observed at the start of the pandemic. The pattern is confirmed as June saw a massive spike in activity for Florida properties. They took it one step further by creating the same visualizations but used the arrival date of actual reservations (booking window). Essentially, they are now comparing Shopping vs. Booking.

Combining the two helps bridge the gap between prospective travel and confirmed reservations. Some people may be looking to travel in the next 30 days, but Beachy Keen's data shows that users are more comfortable making a reservation 3 months later. Beachy Keen will use this information to plan Summer and Fall packages as well as inform the next phase of the strategy, content.

Check out the next post in this series to find out how Beachy Keen uses all of this data to develop a proper content strategy.

Need insights specific to your hotel or resort?

https://screenpilot.com/contact-us/

Did you enjoy the read?

Get original hospitality industry insights delivered to your inbox. Sign up to receive Screen Pilot’s Weekly COVID-19 Resource Center Update.

OUR BLOG

Related Posts

Related Posts

OUR BLOG

Related Post